Import sympy parametric plot modules
%reset -f
from sympy import *
from sympy.plotting import plot_parametric
from sympy.plotting import plot3d_parametric_line
import math

init_printing()        # for nice math output

# uncomment for plot in separate window
%matplotlib qt

# uncomment for plot inline --- DEFAULT
#%matplotlib inline
Declare symbolic variables
t = symbols('t')
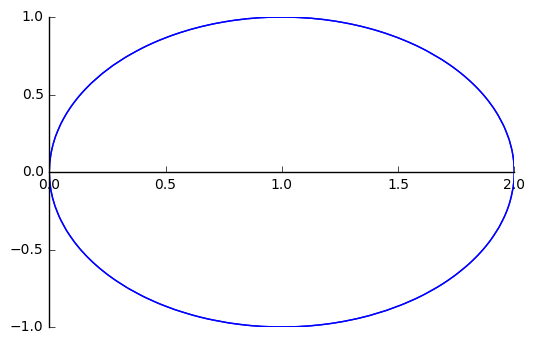
Example: Plot the polar curve
# 2d - Example 1
r = 2*cos(t)

%matplotlib inline
plot_parametric( r*cos(t), r*sin(t), (t, 0, 2*pi))
<sympy.plotting.plot.Plot at 0x7f2934e96690>
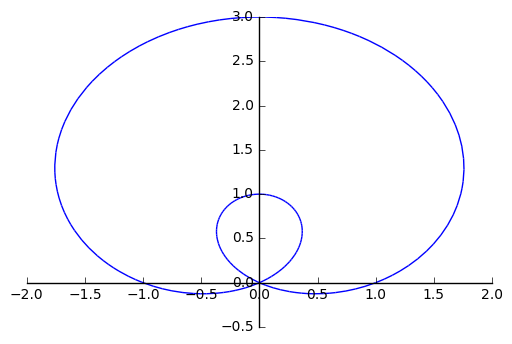
Example: Plot the polar curve
r = 1 + 2*sin(t)

%matplotlib inline
plot_parametric( r*cos(t), r*sin(t), (t, 0, 2*pi))
<sympy.plotting.plot.Plot at 0x7f2934e96490>
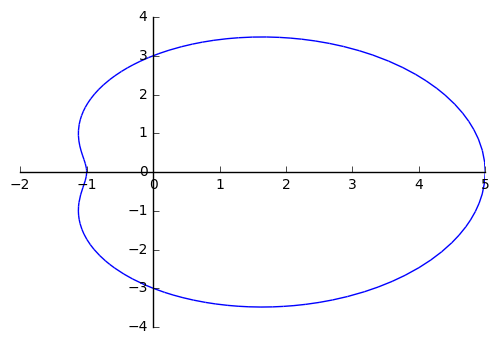
Example: Plot the polar curve
r = 3 + 2*cos(t)

%matplotlib inline
plot_parametric( r*cos(t), r*sin(t), (t, 0, 2*pi))
<sympy.plotting.plot.Plot at 0x7f292551cf90>
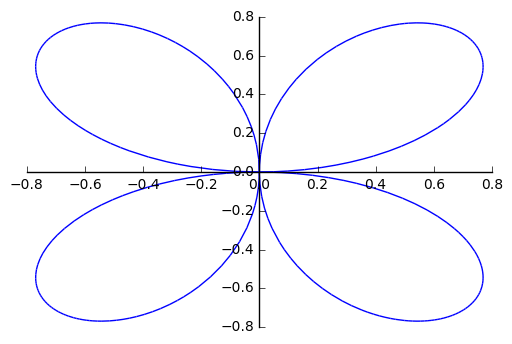
Example: Plot the polar curve
r = sin(2*t)

%matplotlib inline
plot_parametric( r*cos(t), r*sin(t), (t, 0, 2*pi))
<sympy.plotting.plot.Plot at 0x7f2925410450>
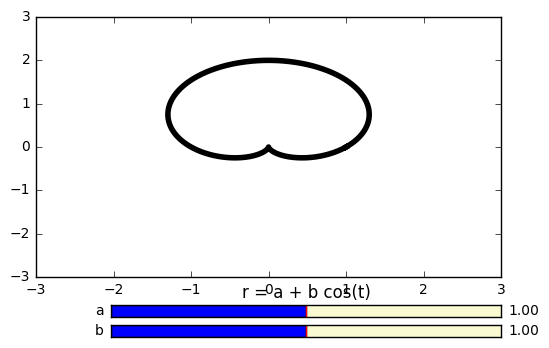
Example: Plot the family of curve curve with slidable and .
%reset -f
%matplotlib qt

import numpy as np
import matplotlib.pyplot as plt
from matplotlib.widgets import Slider

plt.subplots_adjust(bottom=0.25)
t = np.arange(0.0, 2*np.pi, 0.001)

a = 1
b = 1
r = a + b*np.sin(t)
x = r*np.cos(t)
y = r*np.sin(t)


l, = plt.plot(x,y, lw=4, color='black')
plt.axis([-3, 3, -3, 3])

axcolor = 'lightgoldenrodyellow'
axb  = plt.axes([0.25, 0.10, 0.65, 0.03], axisbg=axcolor)
axa = plt.axes([0.25, 0.15, 0.65, 0.03], axisbg=axcolor)

sa = Slider(axa, 'a', 0, 2, valinit=a)
sb = Slider(axb, 'b', 0, 2, valinit=b)

def update(val):
    a = sa.val
    b = sb.val

    r = a + b*np.sin(t)
    x = r*np.cos(t)
    y = r*np.sin(t)

    l.set_ydata(y)
    l.set_xdata(x)
    fig.canvas.draw_idle()

sa.on_changed(update)
sb.on_changed(update)
plt.title('r = a + b cos(t)')

plt.show()
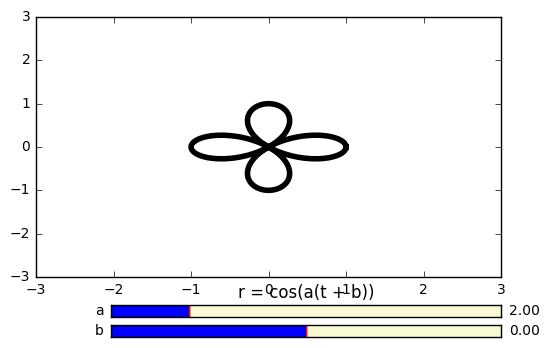
Example: Plot the family of curve curve with slidable and .
%reset -f
%matplotlib qt

import numpy as np
import matplotlib.pyplot as plt
from matplotlib.widgets import Slider


plt.subplots_adjust(bottom=0.25)
t = np.arange(0.0, 2*np.pi, 0.001)

a = 2
b = 0
r = np.cos(a*(t + b))
x = r*np.cos(t)
y = r*np.sin(t)


l, = plt.plot(x,y, lw=4, color='black')
plt.axis([-3, 3, -3, 3])

axcolor = 'lightgoldenrodyellow'
axb  = plt.axes([0.25, 0.10, 0.65, 0.03], axisbg=axcolor)
axa = plt.axes([0.25, 0.15, 0.65, 0.03], axisbg=axcolor)

sa = Slider(axa, 'a', 0, 10, valinit=a)
sb = Slider(axb, 'b', -np.pi, np.pi, valinit=b)

def update(val):
    a = (sa.val)
    b = sb.val


    r = np.cos(a*(t + b))
    x = r*np.cos(t)
    y = r*np.sin(t)

    l.set_ydata(y)
    l.set_xdata(x)
    fig.canvas.draw_idle()

sa.on_changed(update)
sb.on_changed(update)
plt.title('r = cos(a(t + b))')

plt.show()